Email Marketing Benchmarks by Industry
Table of Contents
Email Marketing Benchmarks by Industry

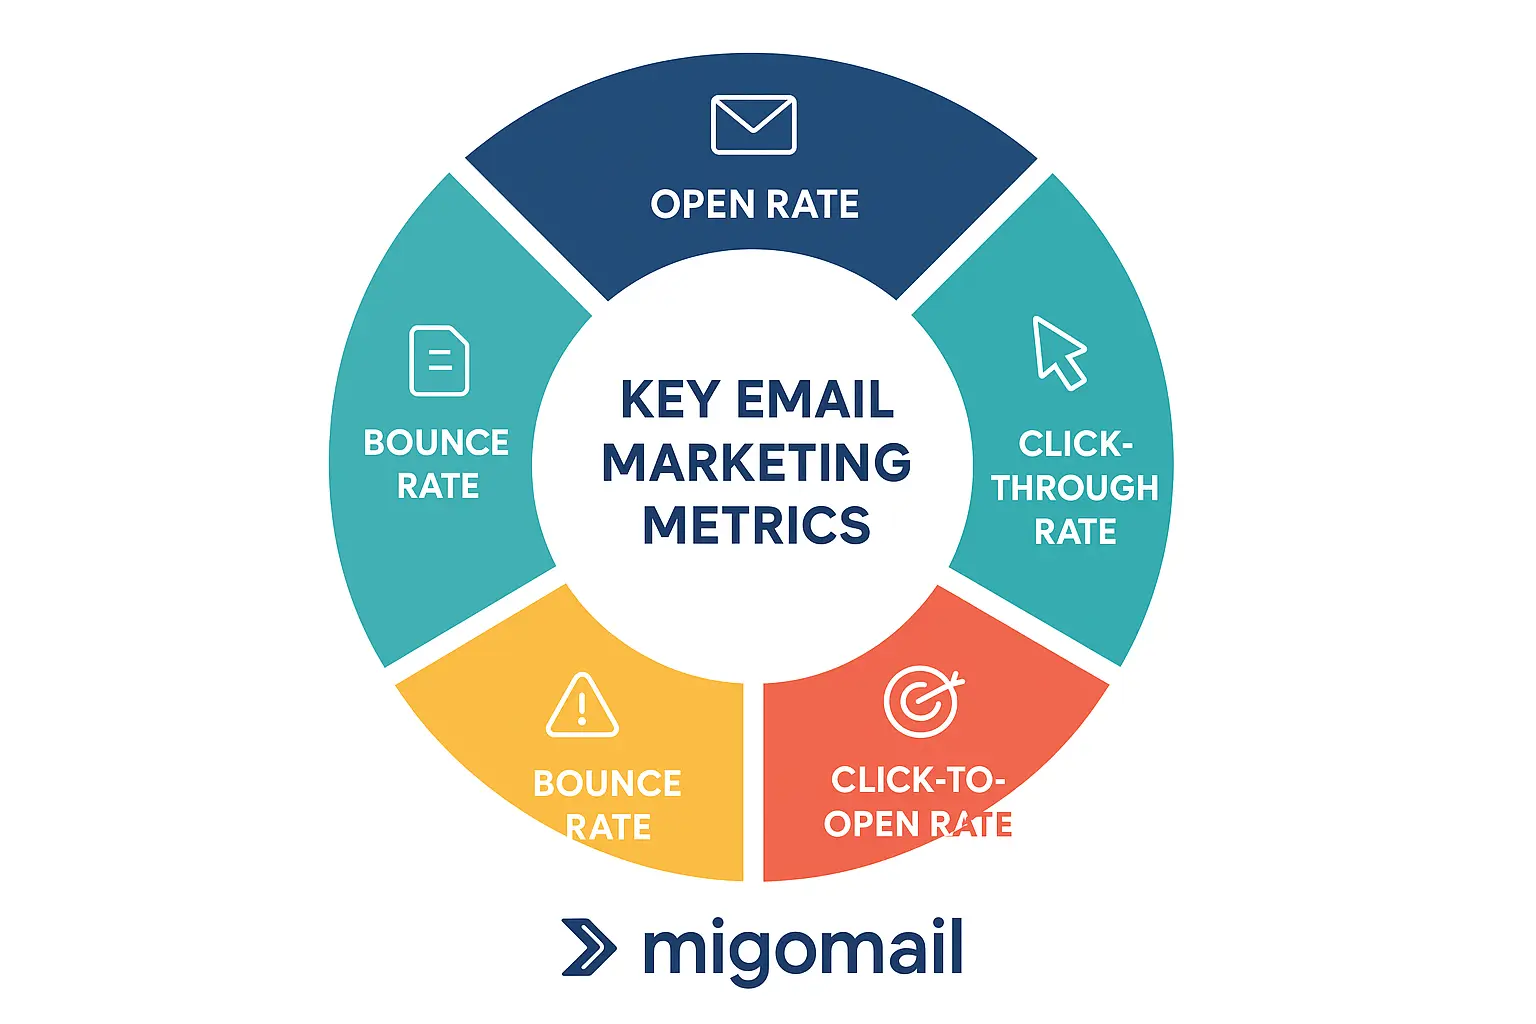
key email marketing matrics
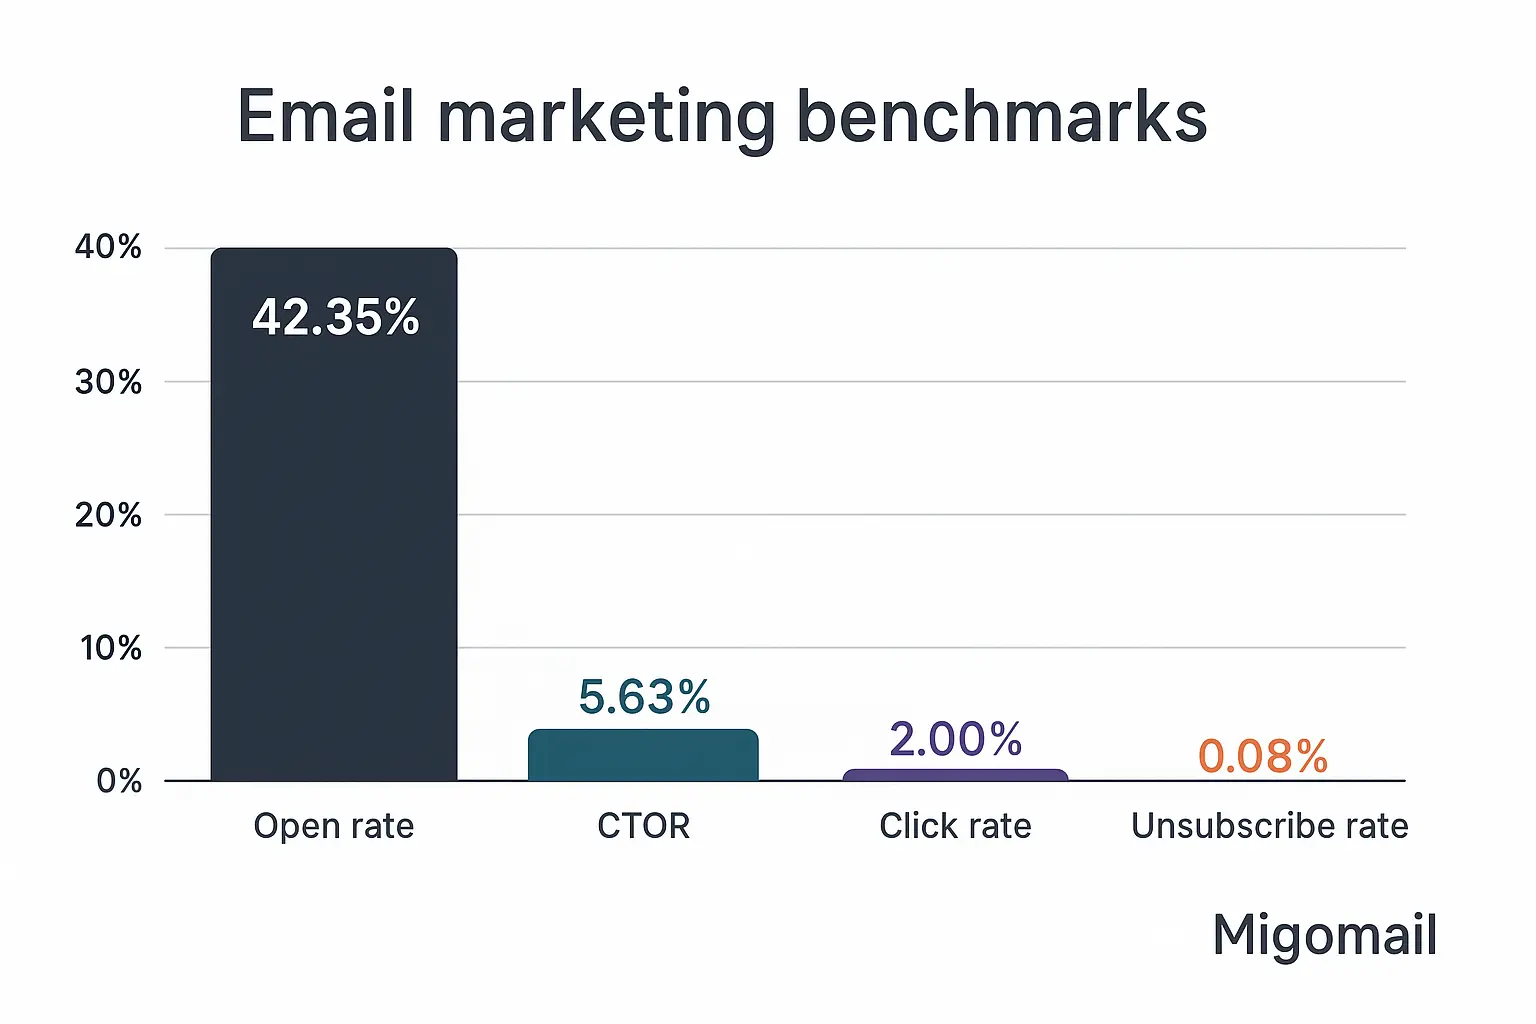
Email marketing remains one of the most effective digital marketing channels, but success rates vary significantly depending on the industry. To evaluate campaign performance accurately, marketers often rely on industry benchmarks such as open rate, click-through rate (CTR), click-to-open rate (CTOR), bounce rate, and unsubscribe rate.
This article provides an overview of common benchmarks across industries, helping you compare your results with industry standards and identify areas for improvement.
Key Metrics to Track
-
Open Rate – Percentage of recipients who open your email.
-
Click-Through Rate (CTR) – Percentage of recipients who clicked a link in your email.
-
Click-to-Open Rate (CTOR) – Percentage of people who clicked a link compared to those who opened the email.
-
Bounce Rate – Percentage of emails that could not be delivered.
-
Unsubscribe Rate – Percentage of recipients who opted out from future emails.

Key Metrics to Track (1)
Average Email Benchmarks by Industry
| Industry | Open Rate | CTR | CTOR | Bounce Rate | Unsubscribe Rate |
|---|---|---|---|---|---|
| Agriculture & Food | 23–25% | 2.8% | 12–14% | 0.6% | 0.2% |
| Arts & Entertainment | 27–29% | 3.0% | 11–13% | 0.7% | 0.2% |
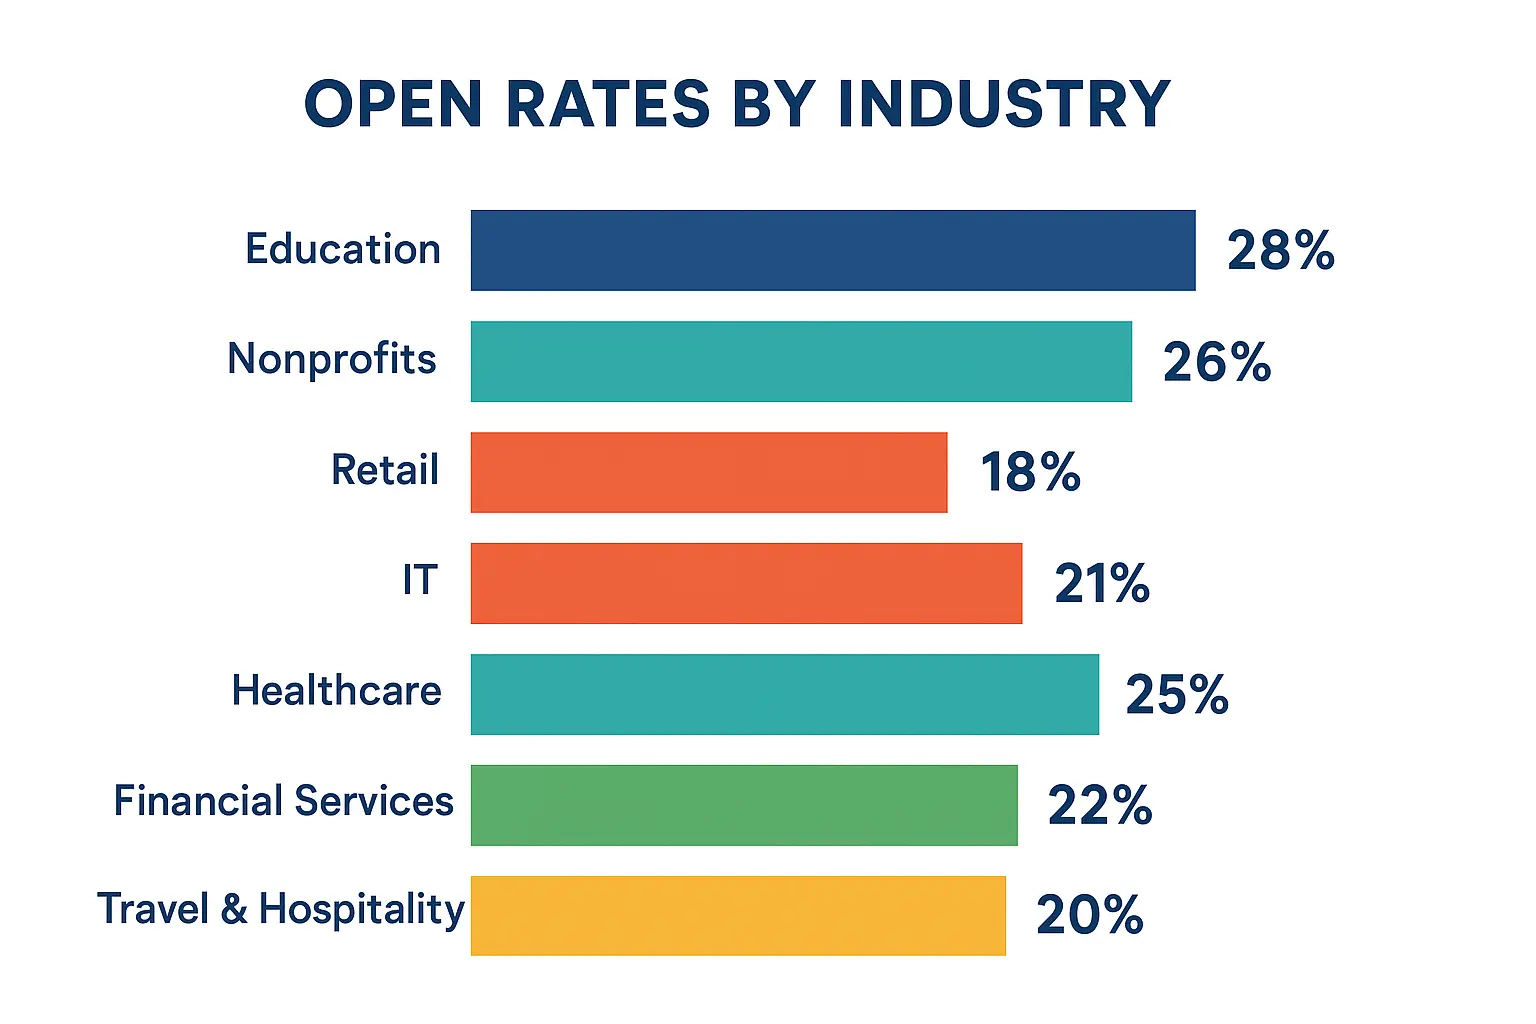
| Education | 28–31% | 3.2% | 11–12% | 0.5% | 0.2% |
| Financial Services | 21–23% | 2.4% | 10–11% | 0.8% | 0.3% |
| Healthcare | 24–27% | 2.7% | 11–12% | 0.6% | 0.2% |
| IT / Software | 20–22% | 2.1% | 9–11% | 0.9% | 0.3% |
| Nonprofits | 25–28% | 3.6% | 13–14% | 0.5% | 0.1% |
| Retail & E-commerce | 17–19% | 2.5% | 12–13% | 0.9% | 0.3% |
| Travel & Hospitality | 19–21% | 2.3% | 11–12% | 1.0% | 0.3% |
| Real Estate | 25–27% | 2.9% | 12–13% | 0.7% | 0.2% |
(These figures are based on aggregated data from major ESPs such as Mailchimp, Campaign Monitor, and HubSpot.)

Email Marketing Benchmarks by Industry
Key Insights
-
Education and Nonprofits often perform above average due to highly engaged audiences.
-
Retail & E-commerce typically see lower open rates but competitive CTR, driven by frequent promotional campaigns.
-
IT & Software faces deliverability challenges due to saturated inboxes and technical audiences.
-
Travel & Hospitality has higher bounce and unsubscribe rates, influenced by seasonality.
How to Use These Benchmarks
-
Compare, don’t copy: Benchmarks are reference points, not strict goals. Your audience may behave differently.
-
Focus on engagement: A higher CTOR often signals strong content relevance, even if open rates are modest.
-
Test and optimize: Run A/B tests on subject lines, send times, and content format to beat industry averages.
-
Monitor over time: Track trends in your campaigns rather than relying only on one-off comparisons.
Best Practices to Improve Results
-
Personalize subject lines and content.
-
Segment your email list by behavior, demographics, or purchase history.
-
Optimize for mobile devices.
-
Keep a healthy email list by removing inactive subscribers.
-
Use clear CTAs (Calls to Action) for better click-through performance.
✅ Summary: Industry benchmarks give you a baseline to measure your email marketing performance. By understanding where your campaigns stand relative to others in your field, you can identify strengths, spot weaknesses, and continuously improve engagement.


